|
Time and
Physical Demands Analysis
By Dan MacLeod CPE
www.danmacleod.com
June 19, 2007
Overview
Time and
Physical Demands Analysis combines biomechanics with time study,
which provides a very practical approach to quantitative analysis. The method
is valuable for a number of reasons:
-
It shows
the physical demands for each step of a job, enabling you to see
more clearly where the problems are.
-
It
includes time in a way that most other methods do not,
enabling you to see how ergo problems usually take longer and
interfere with efficiency.
-
The
graphs are easily understandable by managers and decision-makers,
providing you a good format around which to base a report or
presentation.
-
Using
biomechanics as the foundation of the method bypasses many arguments
on how to combine the effect of different Musculoskeletal Disorder (MSD) risk factors, thus
makes the results more scientifically accurate than other common
measurement systems.
-
The
results are intuitive, i.e., the load on the shoulder is measured in
foot pounds (or Newton-meters in the metric system), rather than a
scoring system of arbitrary units.
-
The method combines key variables into a single graph:
– Posture
– Force
– Motions (each motion is separately observable on the graph)
– Magnitude of the load on the body
– Duration of the load on the body.
T he Time and Physical Demands Analysis is especially good
in making before-and-after comparisons and for showing managers that
physical demands that create risk for injury also waste time..
Note that this method is helpful for studying jobs that
involve full arm motions and bending of the back, although it is not
yet fully applicable for the hand or fine movements of the forearm.
Method
The basic steps are:
-
V ideotape
the task
Review
the video pausing each 0.5 second
Calculate
the loads on the shoulder and back for that frame (in these examples,
the Utah models)
Graph
the results.
Example 1: Wasted time
plus back
strain
|
 |
 |
|
Before |
After |
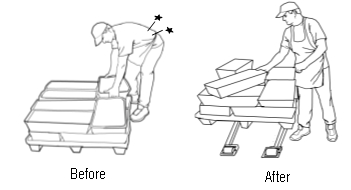
The task in this first example
is a packing job in a manufacturing plant. Before improvements
were made , the task involved bending to lift products from a pallet
on the floor (shown in photo above left), carrying them, sliding on a
conveyor, packing three products, then walking back. The
improvements involved using pallet lifts plus changing the layout,
which eliminated bending and other wasted steps. Afterwards, the
task was simply to pack (photo above right).
The
graphs below show the results from the Time and Physical Demands
Analysis of a single cycle of packing three products, both before and
after the use of pallet lifts. The "before" graph shows the
steps of the job and the strain on the back and time involved for each
step. The "after" graph shows the equivalent once the pallet
lifts were installed and the wasted steps eliminated.
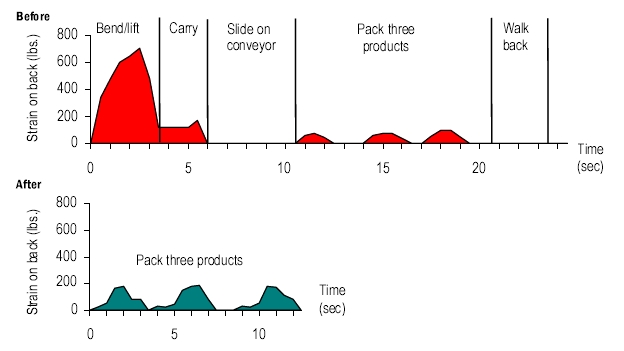
The
visual display of the graphs clearly shows both: (a)
the high strain on the back and the time
associated with bending and lifting, and (b) the reduction in both
time and loads on the back that resulted from use of the pallet lifts.
(See
step-by-step analysis of the graph
for a more complete description, including the loads on the arm.)
The method also permits quantitative
analysis:
| |
Without pallet lift |
With pallet lift |
Reduction |
|
Peak load on back |
707 lbs. |
185 lbs. |
74% |
|
Average load on back |
96 lbs. |
74 lbs. |
23% |
|
Time-weighted load on back |
4630 |
1926 |
58% |
|
Time to complete 1 cycle |
23 secs. |
12 secs. |
48% |
Notes on units of measurement
— Technically, the load on the
back is the compression force on the discs in the lower back, reported
in pounds.
—
The
time-weighted loads are the estimated areas under the curve. These
loads provide the best measure of total strain, but are meaningful
only in comparisons within the same task, thus units are eliminated.
— Loads on the shoulder (not
shown above) are in foot-pounds.
Example 2: Time Savings from a
Pallet Lift
This is a similar
example from a distribution center showing how a pallet lift
reduced cycle time for a simple lifting job by 14 – 20%, plus reduced the load on the spine by
66%.
The graph
below compares lifting a series of eight boxes,
first with the pallet on the floor and then with the pallet lift. The results are superimposed to help
highlight the differences. Each peak
represents one lift. The lower the peak and the less area under
the curve, the less strain on the back. The less horizontal distance at
the base of each peak, the less time needed to make the lift.
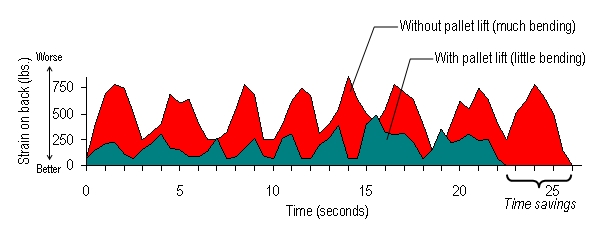
Once
again, the visual
display of the graph clearly shows the benefits of the pallet lift and
raising the boxes off the floor:
-
The peaks
are lower, indicating less risk of injury
-
The area
of the graph is less, also indicating less risk of injury
-
The time
to perform the task is less, specifically eight trays are lifted
using the pallet lift in the time it normally takes to lift seven.
Quantitative results are:
|
|
Without pallet lift |
With pallet lift |
Reduction |
|
Peak load on back |
856 lbs. |
484 lbs. |
43% |
|
Average load on back |
495 lbs. |
196 lbs. |
60% |
|
Time-weighted load on back
(eight lifts) |
26220 |
8805 |
66% |
|
Time to complete (eight lifts) |
25.5 secs. |
22.0 secs. |
14% |
|
Time to complete (full pallet) |
6.5 mins. |
5.2 mins. |
20% |
Example 3: Repetitive motions are a waste of time
 |
 |
 |
| Get
large part |
Push
buttons |
Place completed parts |
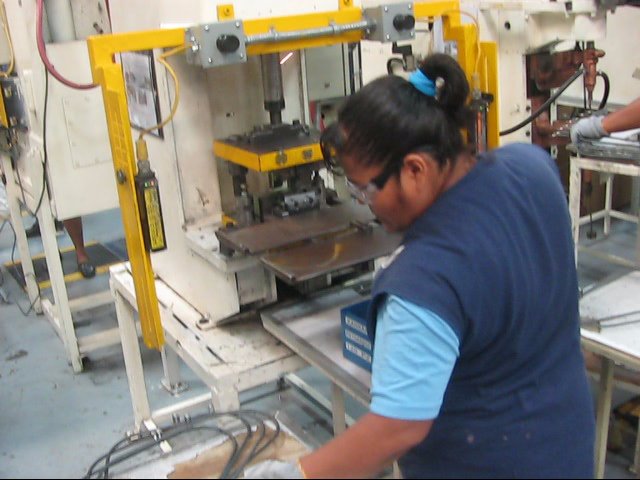
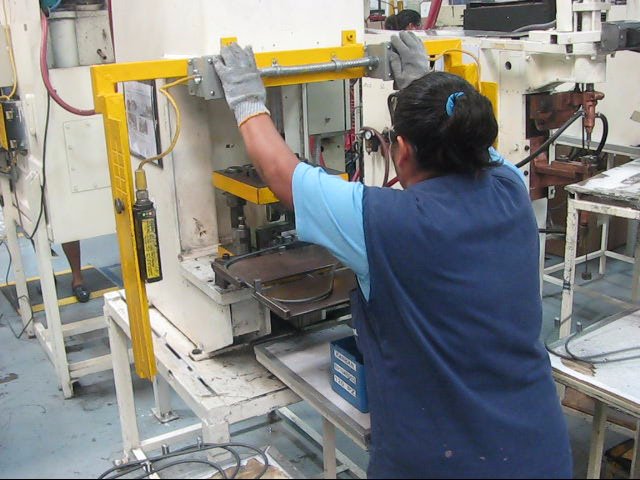
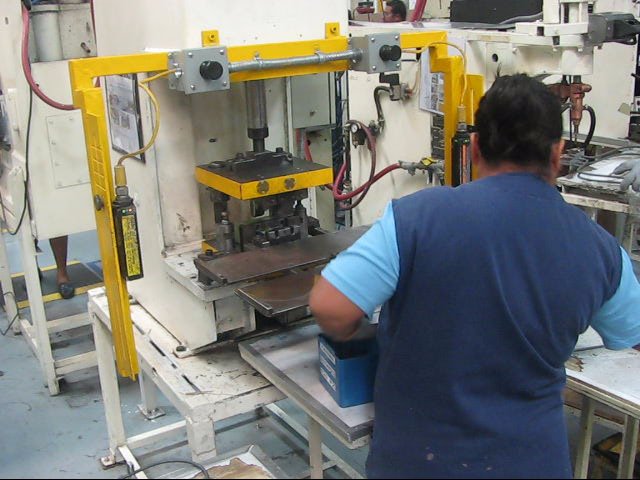
This example is from operating a small power press in a manufacturing
plant. In this case, the focus was on the arms and graphs were
created for both the left and the right arm.
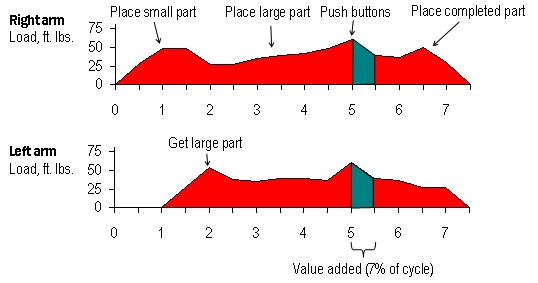
In this case, the steps of the task do not appear very distinct in the
graphs, since the arms are almost continually in motion.
Similarly, the peaks are not dramatically different from the valleys.
The primary value with this study is to show how much time is wasted
because of the reaching — 93% of the cycle! An "after"
evaluation is not available, but improving the heights and lowering
the buttons would yield obvious results.
Example 4: Comparison of three lifting techniques
 |
 |
 |
| Lift 1 (with carry) |
Lift 2 |
Lift 3 (high) |
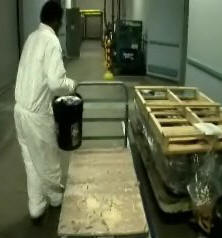
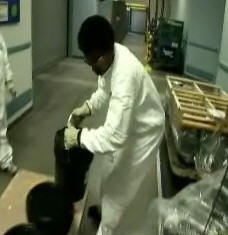
In this study, an employee lifted a heavy drum using three different
techniques. In Lift 1, he carried the drum to a dolly.
Lift 2, he moved the dolly to a better position, so the lift was
direct. Lift 3 involved lifting a drum over another drum.
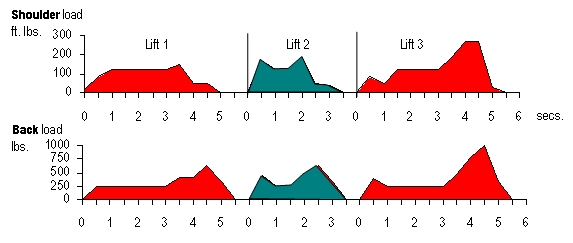
This analysis shows the loads on both the shoulders and on the back.
Lift3 creates a whopping 1004 lb. load on the back. Time
differences that appear insignificant on the plant floor reveal
themselves as meaningful with formal study — in this case, Lift 3
takes 40% longer. As a final note, this method captures the
strain from carrying the load in addition to lifting it, which is
evident in comparing Lift 1 with Lift 2.
|
|
Lift 1 |
Lift 2 |
Lift 3 |
Lift 2 vs. Lift 3 |
|
Shoulder |
Peak load |
148 ft. lbs |
185 ft. lbs. |
271
ft. lbs. |
32% |
|
Time-weighted load |
972 |
691 |
1381 |
50% |
|
Back |
Peak load |
626
lbs. |
626
lbs. |
1004
lbs. |
38% |
|
Time-weighted load |
3235 |
2378 |
4192 |
43% |
|
Time |
|
5 secs |
3 secs |
5 secs |
40% |
Example 5:
Resolving a Labor-Management Dispute
This
example is from a company that inspects and repairs boxes and other
small containers for a major distribution company. The union had
complained that the work was too fast and should be slowed down.
Management claimed that slowing down the work economically unfeasible.
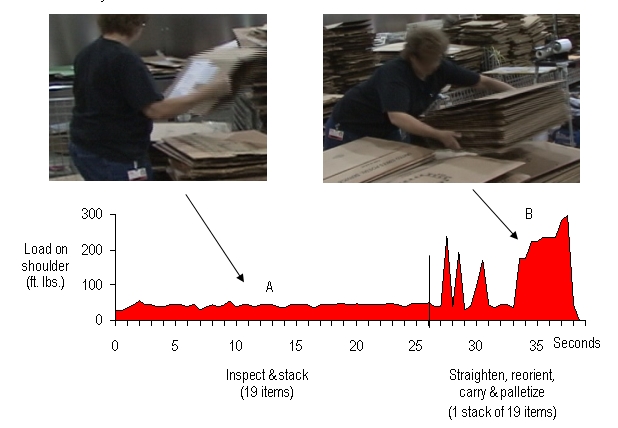
This task
involved two stages: inspecting and stacking the containers (A in the
graph above), then straightening and reorienting the stack and
carrying it to a pallet on the floor (B above). The argument had been
about the time it took to perform step A. However, the analysis
clearly showed that part B was the demanding activity that was causing
the exertion and fatigue.
Moreover,
it was possible to eliminate all of part B by purchasing a pallet lift
and stacking the containers directly onto the pallet. This made about
one-third more time available, both for more rest and for more
production. Thus more containers could be inspected with less effort
and resulted in a win-win solution.
Caveat — “Safe” Limit
As a final
note, I generally do not use this method — or any method — to
determine if a job is “safe” or not. I’m generally more interested in
looking for ways to improve any job, since even if a particular
situation has low risks for injury, there may still be inexpensive
ways to make it more efficient and easier to do. Furthermore, the
scientific studies haven’t yet identified precise “safe” levels for loads on
the shoulders, elbows, or wrists (although such evidence exists for
the lower back).
However,
this method may end up being a good tool for this purpose. It
provides a good way to capture a lot of information on the physical
demands of specific tasks, which then can be compared to numbers of
injuries associated with those tasks to help find out what is
in fact “safe” and “unsafe.”
A good
general rule for practical ergonomics is to play down measurement
systems. If the goal is to solve problems, rather than merely
documenting them, it is much more valuable to get in the habit of
simply watching videos of jobs and focusing on brainstorming
improvements.
However,
from time to time, you may need to quantify the physical demands of a
task. Numbers have power and you may need them to convince
others of the need to take action. Furthermore, sometimes the
problems aren’t so obvious and you can benefit from a closer, more
detailed look.
Contact Dan for complete directions and a
template to facilitate analysis:
dan@danmacleod.com or (570) 242-4664.
______________
*The original concept for this
method was developed by Peter Holzmann, Ph.D., based on his own
proprietary scoring system, which I found too complicated for
practical use. I subsequently tried the Rapid Upper Limb Assessment (RULA)
scoring system,
then realized that biomechanics provided an even better approach to
characterizing physical demands for this purpose. The
biomechanical models developed at the University of Utah for the
shoulder and back provide the best system I have found for this use.
|